
According to the most recent UNCTAD’s World Investment Report issued in June of 2019, estimated global FDI flows were $1.3 trillion in 2018, which is 13% decline compared to the previous year. This is the third consecutive drop in FDI flows.
The decline is largely concentrated in the developed part of the world, where FDI inflows dropped by 27% . This is the lowest number since 2004. In the case of developing countries there is slight increase of 2% compared to the last year, while transition economies experienced drop of 28% in FDI inflows. The below interactive Figure 1 shows more detailed information regarding the global FDI trends in the last two decades.
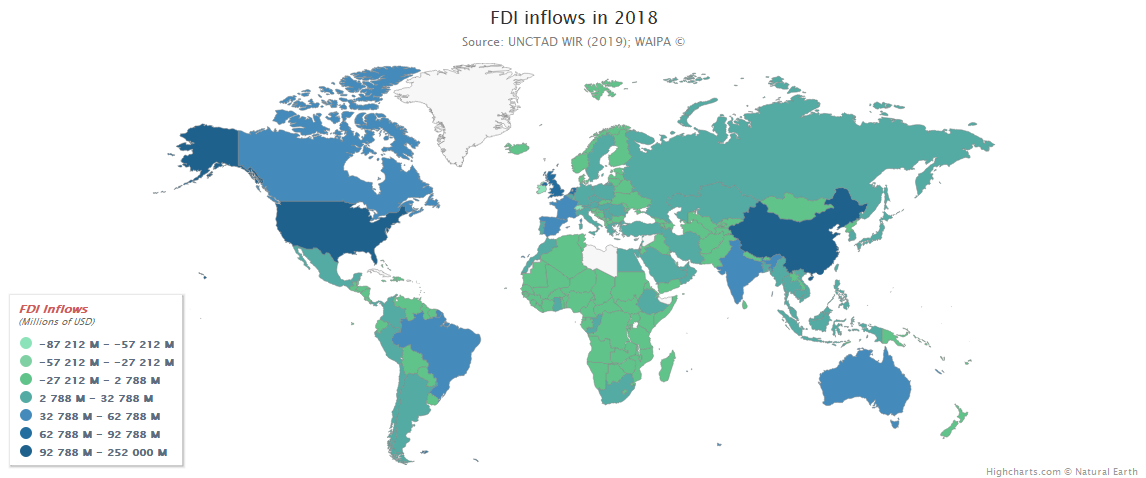
FDI flows by region and economies
When it comes to the regional FDI distribution, Europe experienced staggering 55% decline in FDI inflows compared to the last year. This decline was mainly affected by repatriation of retained earnings by USA’s MNCs resulted due to the new corporate tax income reforms in the USA. New reforms encouraged big firms to bring back earnings from abroad (namely Western European countries) where, approximately, they repatriated a net of $217 billion. The biggest economy of Europe, i.e. Germany, faced with 30% decline in FDI inflows attracting $26 billion of overseas investments. Decline also occurred in the North America and Latin America and the Caribbean where inflows dropped by 4% and 6% respectively. FDI inflows to USA, the largest world economy, declined by 9% to $252 billion. In Latin America, FDI inflows to Brazil, the largest host country in the region, decline by 9% to $61 billion.
Furthermore, developing Asia and Africa experienced slight increase of 4% and 11% respectively. In the Asia flows are mainly concentrated in East and South-East Asia where China, the largest FDI recipient among developing economies, attracted overseas investments worth of almost $139 billion. In the South East Asia, Singapore is leading FDI host country ($78 billion) followed by Indonesia ($22 billion) and Thailand ($10 billion). In South and West Asia, two leading host countries, India and Turkey, attracted $42 and $13 billion overseas investments respectively. When it comes to Africa, the largest FDI host country is Egypt ($7 billion) followed by South Africa ($5 billion).
The global share of developing economies in FDI inflows reached 54% in 2018, where half of the top 10 host economies are developing ones (Figure 3). When it comes to outward investments from developed economies, they declined by 40% percent to $558 billion. Due to this decline their share in global FDI outflows dropped to 55%. However, outward investments from European economies increased by 11% to $418 billion, where France became the third largest FDI source economy in the world with $102 billion of outflows in 2018. Outflows from Asia represent 40% of global outward FDI in 2018, where Japan and China are the largest FDI source economies in the world (Figure 4).
For more information regarding the FDI flows in specific economies see below interactive Dashboard 1.
Main factors behind FDI slide in 2018
Negative FDI trends can be explained by three factors ( UNCTAD, 2019 ):
-
- Policy factor: Tax reforms in the United States evoked repatriation of retained earnings by USA’s MNCs resulting in the negative FDI inflows in many economies. Uncertainty regarding the trade relations also contributed to the FDI slide. Recent unilateral trade policies affected the multilateral trade system causing the delay of investment projects.
- Economic factor: Average rates of return on FDI declined from 8.1% in 2012 to 6.7% in 2017.
- Structural changes in the way international business is conducted: In today’s digital world, reaching global markets does not requires investments that include heavy assets. International production is shifting towards intangibles, i.e. royalties and licensing fees, and light forms of assets.
Implications and FDI prospects
Implications of negative FDI trends are important concern for policymakers as FDI is an important element in countries’ efforts to stimulate and enhance economic development. Lack of FDI is significantly vulnerable for the developing and transition economies due to their need of capital to induce industrialization.
Glimpse of positive FDI prospects is giving the value of announced greenfield investment projects in 2018. They increased by 41% compared to the last year (Figure 5). Announced greenfield investments are often an indication of future intensity of FDI projects. They are also the most favorable type of investment by IPAs ( WAIPA Annual Survey of 2018) as they imply an expansion of the existing capital stock in an economy generating jobs and growth in the short run.
When it comes to the distribution of announced greenfield projects over different industries, the highest value of projects goes to construction services, while the largest number of projects goes to business services. See ranking of other industries in the below interactive graphs (Figure 6 and 7).
Written by

Disclaimer: The views expressed in this article are the author’s own and do not necessarily reflect WAIPA’s stance.