
![]() In 2015, leaders of the world made a collosal promise to eradicate poverty, to protect the planet and to ensure peace and prosperity by 2030. This promise are the Sustainable Development Goals (SDGs), i.e. a collection of 17 goals, with 169 targets, addressing the main challenges of the humanity. In total 5 million people from 88 countries took part in making consensus on such a broad development agenda. Achieving these incredibly ambitious goals however, will require involvement of all parties, i.e. governments, private sector and civil society. So how we are standing in reaching SDGs five years after the agenda was announced?
In 2015, leaders of the world made a collosal promise to eradicate poverty, to protect the planet and to ensure peace and prosperity by 2030. This promise are the Sustainable Development Goals (SDGs), i.e. a collection of 17 goals, with 169 targets, addressing the main challenges of the humanity. In total 5 million people from 88 countries took part in making consensus on such a broad development agenda. Achieving these incredibly ambitious goals however, will require involvement of all parties, i.e. governments, private sector and civil society. So how we are standing in reaching SDGs five years after the agenda was announced?
For providing an answer on the above question we require data. Just as in many other areas in our field, data is an essential part of reaching SDGs as it enables us to track the progress and adjust strategies accordingly. For the purpose of measuring progress towards the 2030 agenda we will use the Social Progress Index (SPI) as a proxy variable. The comprehensive framework of SPI measures the quality of life of countries focusing on social and environment outcomes. The first official version of the index was published in 2014 by the non-profit organization Social Progress Imperative with the goal to “catalyze improvement and drive action by presenting social outcome data in a useful and reliable way”. It is composed from three core dimensions:
- Basic human needs: Meeting basic needs for food, water, and security
- Foundations of wellbeing: Living long and healthy life with access to basic knowledge and clean environment
- Opportunity: Having equal rights and freedoms and access to higher education
These core dimensions are embodied in the 12 components, each having a set of three to five indicators. In total, the SPI is constructed from aggregating 51 social outcome indicators into a single summary measure. All 12 main components are highly related with the 17 goals of 2030 agenda.
Linkages between SPI and SDGs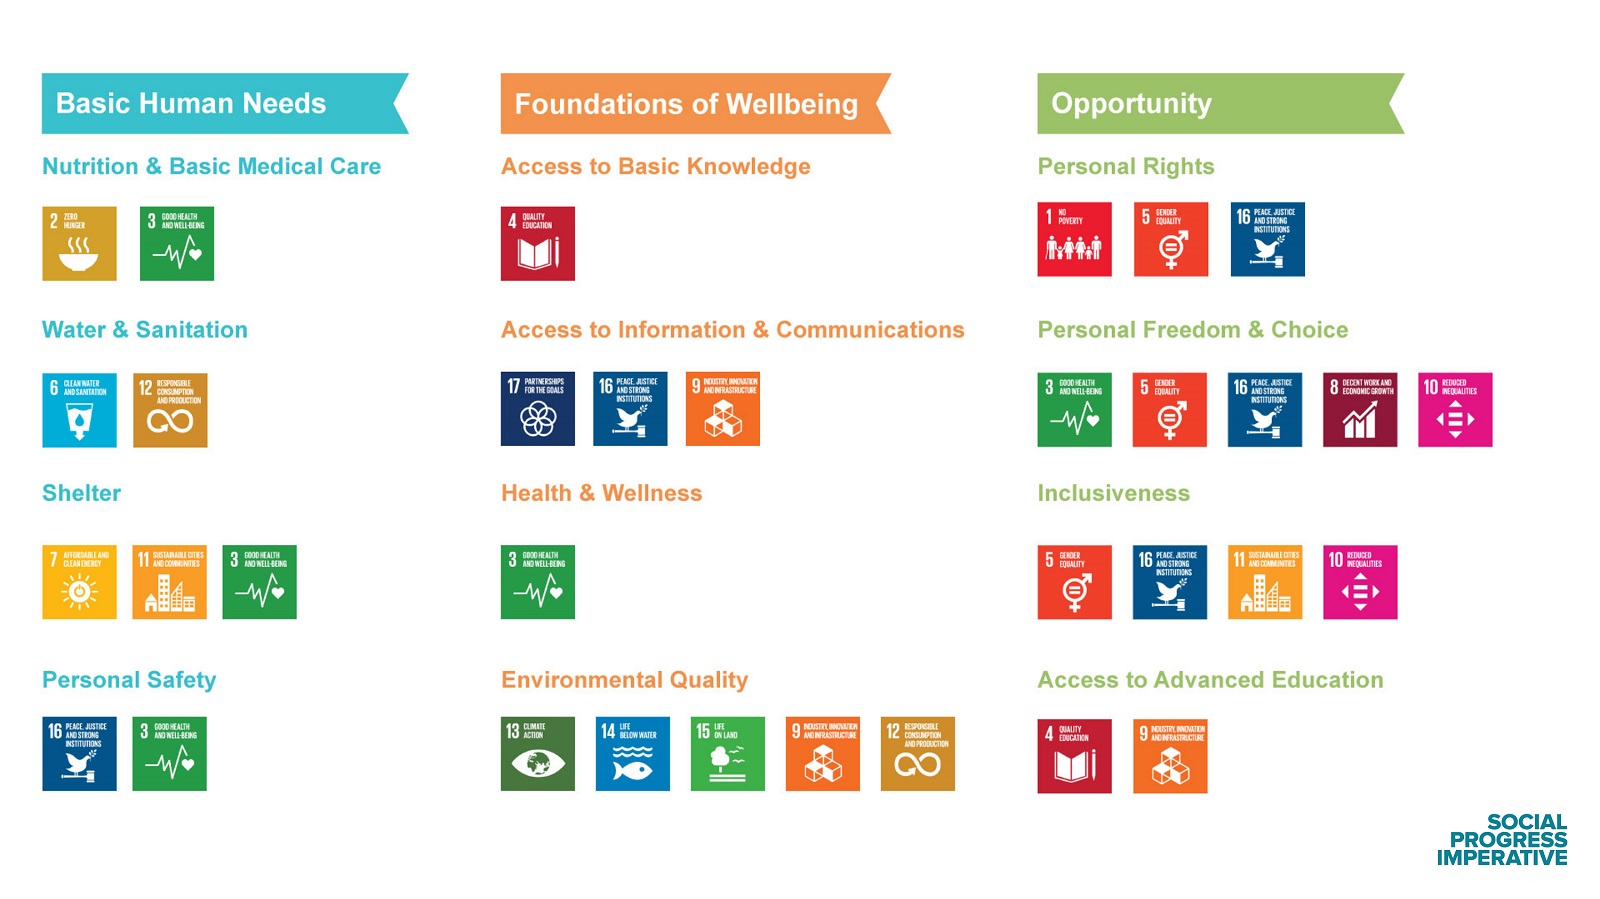
Did we make any progress towards the SDGs?
As previously mentioned, for measuring the progress towards the SDGs we will use SPI as a proxy variable. The SPI is ranging from 0 to 100 while 0 represents lowest progress towards the SDGs and 100 represents the final goal set out to be reached by 2030. According to the 2019 index’s results, the world made some progress since 2014, where the population-weighted world average score increased from 62.16 to 64.47. If the progress continues at this pace however, the world will not achieve the SDGs until 2073.
In the below figure 1 you can see the scores of all countries (149) for which data is available. The best performing country is Norway with the score of 90.95, followed by Denmark (90.09), Switzerland (89.89), Finland (89.56), Sweden (89.45), Iceland (89.29), New Zealand (88.93), Germany (88.84), Canada (88.81), and Japan (88.34).
The majority of countries (92%) have improved by half a point or more since 2014. The countries with the largest improvements are Gambia, Nepal, Sierra Leone, Ethiopia, Myanmar, Eswatini, Burkina Faso, Côte d’Ivoire, Djibouti, and Sri Lanka. More details are provided in the below figure 2.
When it comes to the 12 SPI’s components, the areas in which the world has improved the most are Access to Information and Communications, Access to Advanced Education, Water and Sanitation, and Shelter. On the other hand, the areas in which world has experienced stagnation and deterioration are Personal Safety, Personal Rights, Access to Basic Knowledge and Inclusion. In general, the highest scored areas are the ones of the basic humans needs such as Nutrition and Basic Medical Care, while the lowest progress can be seen in the area of Opportunity dimension, i.e. Inclusiveness and Access to Advanced Education (figure 3). More information on components’ scores of countries can be found here.
Social and economic progress
The SPI’s framework does not include economic indicators making it suitable for understanding the relationship between social and economic progress. The below figure 4 shows relationship between SPI and GDP per capita. The graph is showing a strong and positive nonlinear relationship, which means that two variables are not proportional to each other, i.e. the increase in GDP per capita is not resulting in an increase of SPI at a constant rate. The graph revels that at the lower levels of income, a small increase in GDP per capita is resulting in large improvements in SPI, however, the rate of change in SPI is diminishing as countries reach higher levels of GDP per capita. Furthermore, for some countries with similar income levels, the social progress substantially differs implying that income level is not the only explanatory variable of social progress and that some countries’ economic development is more sustainable.
Figure 4: SPI and GDP Per capita (PPP,USD)
Source: SPI, 2019 & World Bank, 2019
FDI, IPAs and SDGs
As the data shows, the pace at which the world is moving towards reaching the SDGs is not at the desired level if they are expected to be reached by 2030; therefore, global concerted efforts are required to find solutions. Foreign Direct Investment (FDI) can play significant role in this process, particularly the resulting capital flows into SDG-related projects. According to some experts, reaching the SDGs will require $4 trillion investments per year (UNCTAD, 2014). However, what is crucial is not just the quantity, but the quality of investments, i.e. sustainable investments. The sustainable investments which can be defined as “commercially viable investment that makes a maximum contribution to the economic, social and environmental development of host countries and takes place in the framework of fair governance mechanisms (Sauvant and Mann, 2017)” are a challenge but above all also an opportunity particularly for Investment Promotion Agencies (IPAs) as they are the entities usually mandated to promote and facilitate investments. Moreover, due to their essential role as intermediate between investors and governments, IPAs hold an important role in shaping a sustainable future. Thus, naturally, while this has to be a holistic governmental approach for attracting sustainable investments, as both investment facilitation instruments, i.e. laws and regulations as well as investment promotion activities need to be adjusted accordingly, overall there is a need to strengthen the role, mandate and function of IPAs to increase the chance to achieve the transformative vision of the SDGs.
Written by


Disclaimer: The views expressed in this article are the author’s own and do not necessarily reflect WAIPA’s stance.